Category: Energy

  • An Inconvenient Truth – 3 and a bit Years On (s)

    I was recently watching “An Inconvenient Truth” by Al Gore again.

    Again I was reminded of a large amount of doubt and misinformation wandering about the world on the topic of global warming.  Like a frightened rabbit, the lights of the oncoming truck have frozen the collective we to the armchairs and to inactivity.

    Al Gore put it very well: out of a study of 928 scientific journals over a 10 year period all 100% documents concurred that man was causing climate change, principally from CO2 emissions.

    In the face of this evidence, the objective of a small, well-funded group was to “Reposition Global Warming As Theory rather than Fact” (from a leaked internal document).

    Are they succeeding?  Simply, Yes.

    A public survey of popularist non-scientific articles (636 over 14 years) showed that a massive 53% throw doubt on whether global warming is an issue or not.

    Has anything changed in the 3 or so years since this film?

    It appears not.

    I wondered what was happening with the melt rates on Greenland in recent years, since the film.  A quick search of the web revealed that the highest rate ever recorded was in 2007.

    Then I came across this article dated 27th May 2009.  Here’s an excerpt: http://www.ucar.edu/news/releases/2009/sealevel.jsp

    …To assess the impact of Greenland ice melt on ocean circulation, Hu and his coauthors used the Community Climate System Model, an NCAR-based computer model that simulates global climate.

    They considered three scenarios: the melt rate continuing to increase by 7 percent per year, as has been the case in recent years, or the melt rate slowing down to an increase of either 1 or 3 percent per year.

    If Greenland’s melt rate slows down to a 3 percent annual increase, the study team’s computer simulations indicate that the runoff from its ice sheet could alter ocean circulation in a way that would direct about a foot of water toward the northeast coast of North America by 2100.

    This would be on top of the average global sea level rise expected as a result of global warming. Although the study team did not try to estimate that mean global sea level rise, their simulations indicated that melt from Greenland alone under the 3 percent scenario could raise worldwide sea levels by an average of 21 inches (54 cm).

    If the annual increase in the melt rate dropped to 1 percent, the runoff would not raise northeastern sea levels by more than the 8 inches (20 cm) found in the earlier study in Nature Geoscience.

    But if the melt rate continued at its present 7 percent increase per year through 2050 and then leveled off, the study suggests that the northeast coast could see as much as 20 inches (50 cm) of sea level rise above a global average that could be several feet. However, Hu cautioned that other modeling studies have indicated that the 7 percent scenario is unlikely.

    In addition to sea level rise, Hu and his co-authors found that if the Greenland melt rate were to defy expectations and continue its 7 percent increase, this would drain enough fresh water into the North Atlantic to weaken the oceanic circulation that pumps warm water to the Arctic. Ironically, this weakening of the meridional overturning circulation would help the Arctic avoid some of the impacts of global warming and lead to at least the temporary recovery of Arctic sea ice by the end of the century.

    This is a confusing article.   It starts with an ice melt rate of 7% per year – a measured rate, but shifts to discuss melt rates of 3 and 1% which are assumed and in the future (2050 and 2100).  Why is this?  Confused? Wondering what the point is?  7%, 3% 1%, levelling off? Meridional shifts??

    Reference to the recent melt increase rate of 7% per year is obfuscated in the article.  The key observation is: melt rates in Greenland have been increasing at 7% per year.  Why focus on less alarmist scenarios of 3% and 1%??  Less alarming I assume!

    The assumption is that by 2050 the melt rate “levels out”.

    This doesn’t make sense.  The earth is warming?  Why would melting ice slow down?  Wouldn’t it actually get faster?? Aren’t CO2 levels at all-time high??  They aren’t decreasing and there is no expectation of them to reduce to below pre-1900 levels for many 100’s of years.  So why would the melt rate reduce from 7%?  One would expect it to increase!!

    Let’s look at some facts a little more clearly.

    In 2006 the estimated ice melt rate was 239 cubic kilometres per year.

    In 2007 the ice melt rate was 592 cubic kilometres per year.

    There are 2.85 million cubic kilometres of ice in total in Greenland

    The 7% increase per year was determined by looking at the change in earths gravity.

    With an opening comment like this one:  “In the past, the Greenland ice sheet has grown when its surroundings cooled, shrunk when its surroundings warmed and even disappeared completely when the temperatures became warm enough.” ; it kind of says, “ho-hum, what’s the problem.  This stuff happens all the time”.

    Well, there’s no problem really.  Just a few extra meters of sea level, no freshwater in central Asia and extreme arid conditions in what are presently bread bowls of the world.  Not much when you look at after all.

    This does happen, but the natural cycles are every 10,000 years or so.  Plants and animals (including us) can adapt over that time frame.  But over a decade?  They – and we – cannot.

    Al Gore portrayed the equivalence of humans very well with the image of the frog in the warming water…

    Unfortunately, I don’t expect any helping hand to come from the sky to pull us from the rising, warming waters.  We’ll just have our equivalent “boiling alive”, well most of the human race will anyway.

    Major climate change is here to stay.  CO2 levels, like that of CFCs, are at highest levels ever recorded or measured in the last 650,000 years.

    Melt rates are measured to be increasing at 7% per year.

    And with the Antarctic showing evidence of beginning the melting process as well.

    Buy a boat!

    On a less alarmist note, I created my own “climate change model” to predict sea levels dependent solely on melt rates from Greenland.  I assumed all ice cap meltwater goes into the sea, and I assumed no makeup from snow.

    Being an exponential relationship, nothing really happens until towards the end, which is kind of the scary thought – lots of nothing for many years, and then relatively quickly meters of water in only a handful of years.  In the early years, it’s all nice and small incremental change, but as rates increase faster and faster the power of compounding kicks in.  In less than 39 years, sea levels rise by 7.2 meters.

    I’ve ignored the very high increase in melt rates from 2006 (195 cubic km per year) to 2007 (592 cubic km per year).   (That’s a 200% increase, not 7%).

    If one uses that exponential relationship, then Greenland ice cap and the sea levels will rise by 7.2 meters by 2048 – only handful of years away really.  I’ll be keeping an eye on what the melt rates are doing in Greenland!

    Here are the results:

    Assumptions
    2,850,000 Current Total Greenland Ice Mass (cubic kilometres)
    195 2006 melt rate (cubic kilometres per year)
    7.2 meters of sea-level rise if entire Greenland ice mass melted
    0.50 2006 Sea level rise per year from current Greenland Melt (mm)
    7.0% Increase in annual melt rate
    5.0% Acceleration of Increase of melt rate
    Year Melt Rate Increase Melt Rate Year Start Melt Rate Year-End Total Ice Mass Each Year Annual Sea Level Rise (mm) Total Sea Level Rise (cm)
    2006 7.00% 195 209 2,850,000 0.51 0.05
    2007 7.35% 209 224 2,849,784 0.55 0.11
    2008 7.72% 224 241 2,849,551 0.59 0.16
    2009 8.10% 241 261 2,849,300 0.63 0.23
    2010 8.51% 261 283 2,849,028 0.69 0.30
    2011 8.93% 283 308 2,848,732 0.75 0.37
    2012 9.38% 308 337 2,848,410 0.82 0.45
    2013 9.85% 337 370 2,848,056 0.89 0.54
    2014 10.34% 370 409 2,847,666 0.98 0.64
    2015 10.86% 409 453 2,847,235 1.09 0.75
    2030 22.58% 3,585 4,394 2,824,056 10.08 6.61
    2035 28.81% 10,912 14,056 2,783,133 31.54 16.94
    2040 36.77% 43,438 59,412 2,628,357 129.92 56.05
    2041 38.61% 59,412 82,352 2,557,475 179.07 73.95
    2042 40.54% 82,352 115,740 2,458,429 250.22 98.97
    2043 42.57% 115,740 165,010 2,318,054 354.63 134.44
    2044 44.70% 165,010 238,767 2,116,166 510.03 185.44
    2045 46.93% 238,767 350,828 1,821,368 744.75 259.92
    2046 49.28% 350,828 523,715 1,384,097 1104.69 370.38
    2047 51.74% 523,715 794,706 724,886 1665.37 536.92
    2048 ALL ICE GONE FROM GREENLAND = SEA LEVEL RISE 7.2 METERS

    It all happens in the last few years – as the last of the ice slips off the land, and sea levels rise exponentially.

    This does not consider the West Antarctic ice sheet (another 7 meters of water if it melts).

    I’ve seen a few less informed – or rather paid well by others – parade the Global Cooling myth, but I think for little more than ego aggrandisement and their hip pocket.  I like this succinct summary:

    “This hypothesis never had significant scientific support, but gained temporary popular attention due to a combination of press reports that did not accurately reflect the scientific understanding of ice age cycles, and a slight downward trend of temperatures from the 1940s to the early 1970s” http://en.wikipedia.org/wiki/Global_cooling.

    Then have a look at the most vocal proponent Don Easterbrook

    Just follow the money.

    Hey, I’m going to grab a nice book or three, find a nice place and watch what happens over the next 10 years.

    The last 10 have been a ripper for change across the planet.  The next 10 will be a rip-snorter!!

    “The study also shows that seas now are rising by more than 3 millimetres a year — more than 50 percent faster than the average for the 20th century. Mernild and researchers from the United States, United Kingdom and Denmark discovered that annual precipitation decreased between 1995 and 2007. The ice sheet also shrank at a higher rate.”

    Depending on the source, Albert Einstein referred to compound interest as the eighth wonder of the world, the human race’s greatest invention, or the most powerful force of the universe.

    The sad fact is that for the next 30 years or so, the “measured” rate of increase will be small.  It is only the last 5 years where the water level rises dramatically.  Boiling the frog?  Absolutely.

    That’s what this is all about.

    There are solutions but that’s not what this blog was about, now was it?

    world-cities-flood-map-1024-NEW

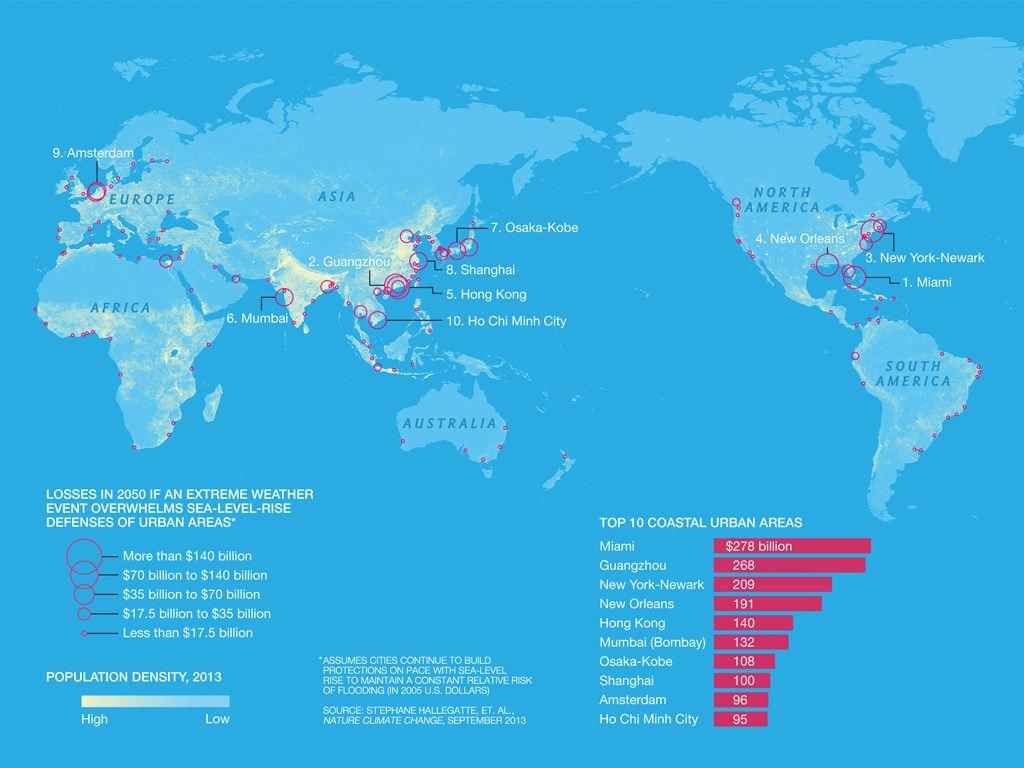
    From National Geographic

    Another update from NASA – warm sea storms, 20 November 2016: NASA Report

    Article from BBC on what’s happening in Greenland in 2019:

    https://www.bbc.com/news/science-environment-49483580

    Thanks for reading!

    Jeremiah Josey

    MECi-Group.com

    TheThoriumNetwork.com

  • Leveraging Resources – Saving the Whales, and Dugongs

    Leveraging Resources – Saving the Whales, and Dugongs

    At the same time as I building my butane sphere I was also “Saving the Whales” or rather the dugongs.

    You see, the BP refinery was sitting at the mouth of the Brisbane River on a small peninsular of reclaimed land from the 1960’s. Every 6 to 36 hours a huge crude oil ship would turn up to disgorge about 100,000 barrels of oil so this 80,000 barrel per day refinery could continue to operate.

    Where the river enters the ocean is called the Moreton Bay Marine Park. The park is the only place in the world where significant populations of dugongs (and sea turtles) can still be found close to a major metropolitan centre. A failure and leak of the crude oil delivery pipeline would be devastating.

    And guess what… The crude oil delivery pipeline had cracks in it. Yes, it was going to leak. Soon.

    Bulwer Island Refinery

    Snaking over the Brisbane River and supported on marine pylons about 5 meters above the water, this 20″ pipeline installed in 1965 was designed in the day for ambient temperature crude oils. Light, clean crude oils running at the temperature of the water it was suspended above. The allowance for thermal expansion (steel expands at about 11 x 10^(-6) meters per degree Celsius) was a series of direction changes placed in the pipeline’s length.

    Steel gets longer when it gets hotter. It’s go to go somewhere. It breaks things – and itself if you try and stop it from moving.

    There where 4, simple butt mitred welds holding the pipe together. The quality of the welds where also terrible and not helping matters. The welds where like a seagull had had a dose of bad sardines. I am a welding inspector also.

    There’s nothing wrong with a design like the pipeline had. Until that is, you start to run hotter crude oil through it. By the time I had arrived the refinery in 1994 – my first gig after leaving uni – the refineries’ inspection department was dutifully monitoring and reporting on the growing cracks in these mitred joints. The crude oil the refinery was processing was heavier and waxier and needed to be pumped at temperatures around 60 degrees. That’s enough for a bad skin burn. The pipe was flexing and moving so much it was pushing other service pipes off the shared pipe support.

    And the main pipeline feeding the refinery was cracking.

    I was tasked to fix it.

    Quotes and estimates from “consultants” where coming in above AUD 10, even 25 million to make the repairs. And I did it for less than AUD 250,000/-.

    This is what I did.

    First I put aside the excitement of such a large project – I had only been at the refinery for 6 months, and had already saved several million dollars by the time this task was given to me (that’s another story). Then I walked the pipe. Up and down the 1300 or so meters above the river, breaking every HSE rule there was. And the 1,000 meters or so on dry land. I was looking at the way the pipe was moving. The cracks were clearly visible, made even more so by the white die being used for the mag- particle inspection. I’m also an NDT inspector.

    The next thing I did was create a stress analysis model of the pipeline using AutoPIPE – a cool and pretty straight forward tool. I created the model from scratch using old refinery blue prints and verification on site. The model showed that the cyclic stresses where growing the cracks but they would never go critical and rupture. That was good news. But a leak is a leak and it had to be fixed.

    By the way, if you don’t know much about metals, steel has a “critical crack length” which means that when a crack gets to a certain length in a piece of steel (or any metal or material too), the piling up of lattice dislocations locks up and the metal experiences a brittle, sudden failure. The 1 inch thick steel of the pipeline walls was below the critical crack length at the stresses it was experiencing so the metal would continue to tear and never rupture. It would leak into the river. Not explode into the river.

    The next thing I did was walk the pipeline again and I noticed something interesting. The consultants were telling me that the only thing to do was put an expansion loop out over the water section of the pipeline. New marine pylons would be required and that is where the expense was coming from. I can still see the consultant rubbing his hands together now. [Protip: never ask a hairdresser “do I need a haircut?”]

    But something didn’t feel right. There must be an easier way.

    The Mother of all Expansion Loops

    When looking closer at how the pipe was moving I dived into the pipe design code ASME B31.3** and studied the appendices. And there it was: a beautiful mathematical formulae showing stress as a function of bend pressure AND bend radius. The larger the bend radius the lower the pipe stress. I could dial in a crack free stress by adjusting the bend radius of the pipe.

    In the refinery piping game there are either Long Radius bends or Short Radius bends. This is what ASME B31.3 covers and people rarely go into the detail to use anything else. But there wasn’t enough space for either of the standard bends using the existing marine pylons. They just didn’t work. So, jumping back into my AutoPIPE model I set a temperature limit of 85 degrees (way above any crude oil that the refinery was capable of processing) and worked out what the acceptable radii needed to be for each change in direction for the pipeline. There were 4 changes in direction out over the water that needed special attention.

    Then, armed with my trusty tape measure I went back out onto the pipeline (thanks HSE) and checked if there was enough space for movement at my high temperature design with special long radius bends. There was.

    Eureka!

    The next step was to triple validate my calculations. I re-did them manually. I talked to everyone I could about my design. Even the refinery’s main advisory consultant – a former employee and friend of the refinery manager that found an office outside the fence paid more than one inside. He could find nothing wrong with my approach but he refused to validate my work in writing. I think I know why today. So I finally sent off a CYA letter to ASME in the USA, copy to the refinery manager, explaining that everything I was doing was within code and to come back to me if there was a problem.

    The Main Special Radius Bend

    They never did, and I wasn’t waiting for them to answer. I knew what I was doing.

    The work would be hot, meaning there could be explosions if things went wrong, and that meant lots of precautions. The refinery manager had also made it clear to me: not a single drop of oil could reach the river. Of course. Was I stupid? Dugongs don’t like oily food. They eat sea grass.

    Then in short succession I drew up the designs, had the 4 special bends made in Sydney and shipped the 900 km to the refinery, tendered and awarded the construction work and worked out a plan to undertake the repairs all within a 12 hour working window so there wouldn’t be a refinery shut down or a hold up to the next ship wanting to arrive and deliver oil. I had 8 crews working simultaneously to cold cut, bevel and prepare the pipe and insert the prepared new pipe spools. There would be 20 cold cuts being made at exactly the same time. It was pretty cool to watch, and Hans Walter, owner of the construction company doing the work was amazing. I learnt a lot from Hans and his leading man.

    I had earlier negotiated with the operations team to hold a crude delivery ship over longer than necessary (demurrage is an expensive thing) and pump 100,000 barrels of sea water through the pipeline. I had another project on the go: raising the height of a crude oil storage tank by adding an extra strake so secondary seals could be fitted to reduce VOC releases (Tank 104. That’s another story). The tank was ready for hydro-testing, so I needed to fill it up with a lot of water fast. It was a perfect synergy: clean the pipe, fill the tank. The water would be released back into the river using the refineries biological water treatment facility. Oil is a natural material after all and bugs will eat it if given the right conditions. The ops team where more than happy to oblige. By the way, I held the next ship for a few extra hours too, getting it to fill the pipeline with water so we could hydrotest it – an important final task to ensure there where no leaks.

    Last Landfall Loop

    In preparation for the opening of the pipe I had a survey done of the pipeline level so I could calculate how much water was still laying in the pipe once it was washed out. Then I negotiated with the Port of Brisbane Authority to “borrow” several floating barges and had them fit them with tanks sized according to how much water would come out at each location. Later analysis showed that zero oil remained after the last crude ship had filled my tank with 100,000 barrels of sea water the night before. I couldn’t even make my hands dirty by rubbing the inside of the pipe when it was finally cut open in many places at once.

    It all went off without a hitch. There where three notable events:

    • During the draining of the remaining water (holes where hand drilled at the two of the main sections to be cut out – that’s what my pipeline remaining water level analysis showed) one of the drain hoses fell out from the tank on the floating water barge. I leapt down from the scaffolding and in a single bound – like superman leaping over a tall building – launched over the tank and sliding down the other side, in a single motion grabbing and re-inserting the itinerant hose back into the tank opening. It happened so fast no-one had even moved from their initial shocked position. The water than escaped stayed on the barge.
    • The refinery manager criticised me for leaving “6” flanges over the water”. There are 10 of them. They where needed to pull out the welding balloons used to ensure a gas free safe welding environment. These 6″ nozzles had been attached and hot tapped in preparation for the 12 hour working window, as had most of the work, pipe supports, earth works on land etc. But I wasn’t worried. I had used special spiral wound gaskets with extra sealing capacity far beyond what would have been necessary. And written up a special procedure for closing the nozzles which including torquing the bolts, There’s never been a leak.
    • I lost my temper once when at one of the bends, the smallest one, there was a lone worker who didn’t wait for the draining to be completed, and started his cutting too early. Luckily he was at a high point in the pipeline and luckily I arrived to check in on him as the water started to escape. He stopped cutting and held in the leak with his hand once I stopped yelling at him. It took a while before the water drained away from his location and he could continue his work.

    The whole project took 5 months to complete. It was mostly a coordination exercise and it worked perfectly. It wouldn’t have happened without the full support of all the team players to carry out the strategy once it had been determine as sound and robust.

    Full credit goes to my favourite Russia Alexy Lydov. A veteran at the refinery and in his late 70’s, he was there, direct from Russia, when it was built 1964/1965. I made a point of discussing with him everything I did during my time at the refinery. It was his idea to use welding balloons to enable the special joints to be welded in safely. That made the whole plan workable. His practical and clever Russian style thinking aligned with my get-it-done, can-do approach. He also knew where all the refinery blue prints where, and every design aspect that was relevant to know.

    ** I wanted a more rigorous design code than what you get from using API pipeline codes. It was a refinery after all

    Jeremiah Josey

  • New Oil and Old Hopes – The Bakken Formation

    I didn’t know about this one: The Bakken Formation in central USA.

    A recent U.S. Geological Survey (USGS) report from April 10, 2008 documents the oil reserve in these rocks. Somewhere around 200 billion barrels that lie conveniently in the middle of the USA.

    The USGS announced that there is about 25 times more oil to recover than previously thought. 25 times? That’s a big difference.

    To put this quantity of oil into perspective, Saudi Arabia – the largest remaining reserves in the world – has about 200 billion barrels left, and Kuwait – where I am now – has about 50 billion barrels of oil left to go. [That’s about 70 years at current production rates ;o) ]

    The Bakken however only has about 1%, or 2 billion barrels that is recoverable using current technologies.

    Why so low?

    The difference is that because of the poor flow charateritsics of oil in the shale formation (low porosity and low permeability). The Bakken oil doesn’t like to come out.

    Still 2 billion barrels of oil is enough to drive the present US demand for about 1,000 days, or 2.7 years (at a consumption rate of roughly 20 million barrels per day).

    Hardly seems worth it does it?

    Then again, if you assume an oil price of USD 50 per barrel, 200 billion barrels is worth about 1 trillion USD dollars… Still a lot of bikkies, and hey! that’s similar to the amount of money recently used by the US government to bail out a few troubled banking and automotive companies.

    So what if more could be extracted, using different techniques? You bet there are a lot of interested people looking at it right now.

    By the by, I was close to a shale oil project in Queensland, Australia: the Stuart Shale Oil Project for Southern Pacific Petroleum (SPP were my clients when I was running a division of WorleyParsons).

    These shale oil reserves – the Stuart and Rundel fields, a few billion barrels each I recall – are actually Kerogen: like the early stages of oil. It hasn’t had enough time, heat or pressure to become turn into liquid form. It’s hard crumbly black stuff. No oil at all!

    That’s where man comes in: a retort is used to pyrolyze the oil shale turning it into a liquid form that can be refined using conventional oil refining processes.

    Sounds messy doesn’t it.

    It is.

    And expensive.

    CO2 emissions?? Wow! Don’t even go there.

    I like the Swedish approach to oil: get off it all together! (They intend to by 2020).

    Jeremiah Josey

    Blog of Jeremiah Josey

  • How to Become Insanely Rich

    How to Become Insanely Rich

    It has been more than 12 years since I built one of my first major capital projects. I was 24 at the time. I hunkered down to do everything that needed to be done to build a major piece of critical infrastructure in a multi-billion dollar refining operation. And I did it all within 12 months.

    My project was only AUD 2 million, but it was fun. It was 12 months from literally cornering the lead process engineer in his office to size the capacity required (16 meters in diameter) [Pro tip: emails don’t work], specialised steel selection and shell plate manufacture, a QRA with Det Norske Veritas of Norway, Hazops, contractor selection – from the best in the world and a specialised ultra low NPSH vertical multi stage high pressure transfer pump. It was the largest and most sophisticated butane storage facility of it’s type in the Southern Hemisphere.

    You know what my biggest lesson was? The payback. During the summer time, this storage sphere could store 1000 tonnes of “waste” butane coming from the main refinery process over summer. It would be burnt in a huge flare stake previously. The butane could then be injected into the gasoline fuel mix during winter when the Reid Vapour pressure was lower. The payback for this AUD 2,000,000 investment: 3 months. Yes, only three. I did the calculation several times to validate it. Just to check I was seeing it right. Over the past decade this assembly of concrete and steel has paid back something like AUD 100 million. With minimal costs. Now that’s an investment.

    There’s me. The fireproofing is being applied to the legs behind me. You can see where it is here.

    Jeremiah Josey

  • The End of Royal Dutch Shell?

    Today I read of the demise of Royal Dutch Shell – that huge unconscious behemoth employing 104,000 people around the world with 22B profits and revenues greater than USD300B per year.

    Well it wasn’t the specifically the demise, but the decision – that defining moment  that will lead to Shell’s demise – that I read about.

    The article was in Professional Engineering, 25th March 2009, Page 4:  Royal Dutch Shell has announced that it will no longer invest in renewable energy sources (wind, solar and hydropower). Whilst it will still remain a “committed member” of the Energy Technologies Institute (ETI)*, Royal Dutch Shell will invest in biofuels and carbon capture.

    Why do I say that this is the beginning of the end for Royal Dutch Shell?  Isn’t the world looking at carbon capture?  Isn’t “clean coal” the new buzz word?  Isn’t corn ethanol our salvation?

    No they are not.

    Carbon capture simply raises the costs of using existing fossil fuels, and defers the problem of carbon dioxide disposal to future generations.

    Biofuels are not only expensive and marginally carbon neutral, they raise the cost of food for people, and increase the rate of degradation of the worlds remaining, dwindling farming lands.

    Free, abundant energy from the Sun is the answer – captured by photovoltaics, wind power and hydro.

    Remember, that wind is also created because of the Sun: hot air rises, and cool air rushes in to fill the gap: wind power is solar energy one step removed. Hydro: capturing the energy of falling water from rain caused by heating of the earth by the Sun, solar energy two steps removed.

    Shell is missing an important factor: the rapidly reducing cost of producing electricity from solar panels.  

    By 2015 using the Sun to directly produce electricity from photovoltaics will be an economic reality for every one. The cost to produce electricity is presently around $0.20 per kWhr and with reducing manufacturing costs this will reach $0.10 per kWhr by 2015 – directly competitive with power from coal, with no government subsidies or incentives in sight!

    This is supported by research from the RMI (Rocky Mountain Institute). [Here’s Amory Lovins, director of the RMI, speaking about it: Amory Lovins on winning the oil endgame]

    First Solar: the worlds largest billion dollar manufacturer of solar cells is rapidly approaching 1 GigaWatt in annual production capacity. They are already manufacturing at $0.93 per Watt – this is as of the 30th of April 2009.

    So why has Shell taken this monumental decision – not to invest in wind and solar – only a handful of years from the tipping point?

    A few reasons:

    Shell is a fossil fuel company making business by selling the stored energy of the sun for over 100 years. The leadership, the management, and hence the culture of Shell is fossil fuels. This inertia is difficult to refocus.

    Fossil fuels are also still highly profitable: production costs are still less than $10 per barrel in most parts of the world (and here in the middle east, it’s less than 2), so there’s a heck of a lot of profit still to be made. And profit, well that will drive us for a long time to come.

    The worlds present infrastructure, the system, is built on a fossil fuel economy. As a people we fear change, and strive to maintain a constant regular environment around us.  This drives short term thinking and puts off long term decision making.

    Perhaps Shell believe they can delay the tipping point?

    Can they can buy up – and lock up – the new technologies. Yes, I suppose they could, in the short term. What lengths would you go to to protect a $300B business? You certainly have a lot of money to support what ever strategy you wanted!

    For example, technology developed by Stanford R. Ovshinsky, leader in thin film photovoltaic and Li-Ion battery technology – was bought and locked up by Exxon Mobile in the early 2000’s.  (Watch “Who Killed the Electric Car” for this reference). What has happened since? Newer, better technologies, made the purchase by Exxon redundant. It slowed the shift but didn’t stop it.

    So what?  So solar panels can make cheap electicity?  Who cares? Well everyone will.  When the cost of placing solar panels on the home roof is less than the annual fuel bill for the home car, then most people will want to switch to an electric car and charge it with the power collected from those solar panels (Electric car technology is more than suitable right now – see Tesla Motors, backed by one of the founders of Google, or the stylish two seater vehicle from Aptera Motors).

    A shift will occur.

    Four  key things will happen:
    1) Demand for electric cars will surge
    2) Demand for oil will drop
    3) Power generation will become decentralised, as consumers control the generation of their own electricity
    4) Demand for coal will drop

    The age of fossil fuels will be over.

    And Shell, by the looks of their current policy will be over with it.

    How long will the shift take? Perhaps 10 to 20 years after the tipping point is reached. Perhaps less. The first world war (1914 – 1918) was a war waged on crude oil.  The diesel engine was developed a mere 25 years earlier in the 1890’s. Trucks, tanks, battlecruisers and even cars and planes using similar technology where all driven by refined crude oil was used for the first time on a huge scale during this war.  It established the fossil fuel economy.

    So the time frame for the next shift will be about the same, perhaps less because sharing the information can now happen at the speed of the internet.

    What a time to be alive!

    Jeremiah Josey

    * By the way, Royal Dutch Shell has committed a paltry 50M GBP to the ETI over 10 years. The company profit presently exceeds 60M GBP per day.

  • A Note to Arnold Schwarzenegger

    I sent this email to Arnold a few days ago.

    Hi Arnold,

    I don’t know whether to call you Mr Schwarzenegger, Arnold, or Sir, but as I’ve grown up in Australia and formalities, well just aren’t the thing we focus on, so I figure Arnold will do for now.

    Today I drove for the first time east along CA-58 and saw an amazing gathering of electrical wind turbines on the western hills of the Mojave Desert.

    I’m holidaying in your great state and thoroughly enjoyed the view I saw. I’m presently working in Kuwait managing the building a critical pipeline to keep their production at number 4 in the world, so to see such a plethora of “clean, green energy” product brought a tear to my eye.

    I did some quick research to find that these turbines can produce up to 30% of California’s power requirements. Amazing! (I saw a few vacant hills – when will it be 100%?).

    I researched some more and was a little dismayed to find limitations on using the electricity created because of infrastructure limitations: the electricity simply cannot be delivered to the users.

    See here for more:

    http://www.commondreams.org/headlines01/0331-01.htm

    This is an old article – from 2001, so I do not know if the power transmission lines have been improved to connect the wind farms of the Mojave area to the rest of the Californian electrical grid, however I still saw a large number of inactive turbines, larger than what I would expect to be out for maintenance reasons.

    Either way, I salute you for all your efforts, and all the best for the future. I understand that this is your last term as the Governator!.

    Jeremiah Josey
    www.linkedIn.com/in/jeremiahjosey

    It was great to get his reply a few days ago:

    —–Original Message—–
    From: governor@governor.ca.gov [mailto:governor@governor.ca.gov]
    Sent: Thursday, 5 March 2009 11:00 PM
    To: jeremiahjosey@gmail.com
    Subject: Re:Energy Issues/Concerns

    Thank you for sharing your thoughts with me.

    California was built by the ingenuity and hard work of its people, and our great state continues to thrive because of their involvement and commitment.

    I greatly appreciate receiving input from my fellow Californians about the issues important to them. Taking the time to communicate your opinions and offer suggestions is essential to good citizenship and good government.

    Again, thank you for taking the time to write. I value the comments of people like you who care about the future of California.

    Sincerely,

    Arnold Schwarzenegger

    Jeremiah Josey

Jeremiah Josey