Tag: crude oil
-
The End of Oil? Oil Pricing for 2015 and the Rise of Solar Energy
Best Business Practices, Energy, Global Issues Affecting all of Us, Money, Solar Power, Technology, The Middle EastAn Arabic prophesy half way in the making? of a monetary glitch in the status quo? I wrote the article for the Al Jarida newspaper of Kuwait and it was published on Saturday 24 January 2015. It’s a further development of my previous blog on how technology is changing the way the energy market operates…
Written by
-
2015: The Year For the Downside of Solar Energy and the Upside of Banking
How financial success for some doesn’t equate to project success for others. Photographer: Chris Sattlberger/Getty Images Downside of Solar? Yes, downside. The side where you slide down and things get easier and more efficient, and lower priced, and better, and people want more of it. That’s what is happening with solar power. Look at this…
Written by
-
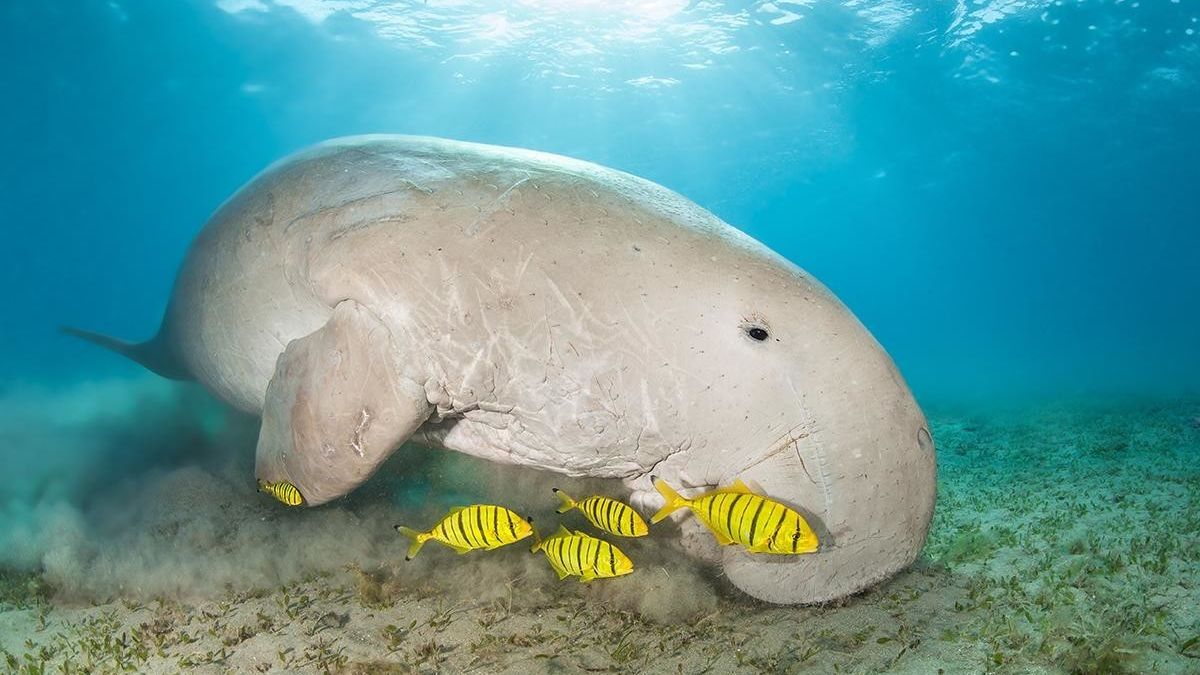
Leveraging Resources – Saving the Whales, and Dugongs
How team work and leadership is vital for protecting fragile environments. Not just dollars. At the same time as I building my butane sphere I was also “Saving the Whales” or rather the dugongs. You see, the BP refinery was sitting at the mouth of the Brisbane River on a small peninsular of reclaimed land…
Written by